

Scroll to the bottom to watch the YouTube tutorial
Learn about pump curves, how to read them and what the different lines mean.
State Supply is your source for steam and hydronic heating system components, such as steam traps, valves, controls, and pumps (including the industry’s top brand like Bell & Gossett, Taco, and more). Visit www.statesupply.com or call us toll-free at 877-775-7705 for an unparalleled selection of products, knowledgeable experts, and outstanding customer service.
Check out centrifugal pumps ➡️ https://www.statesupply.com/pump/hydronic
View pump repair & maintenance videos ➡️ https://www.youtube.com/statesupply
Download this guide ➡️ https://www.statesupply.com/boiler-inspection-checklist
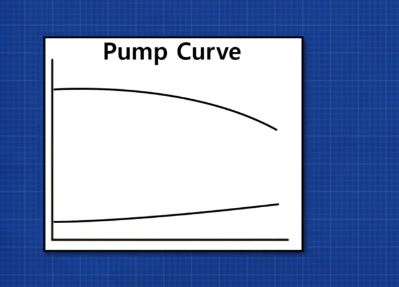
Basic Pump Curve
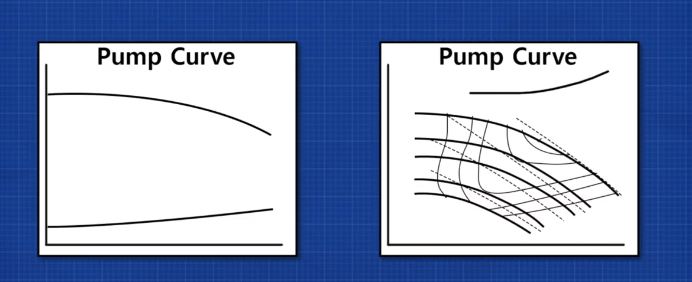
The basic pump curve looks like this.
They do get more complicated and look something like this. Don’t worry we’re going to go through them step by step and start from the basics.
Each type of pump has a different chart and the data plotted on them also varies with the model.

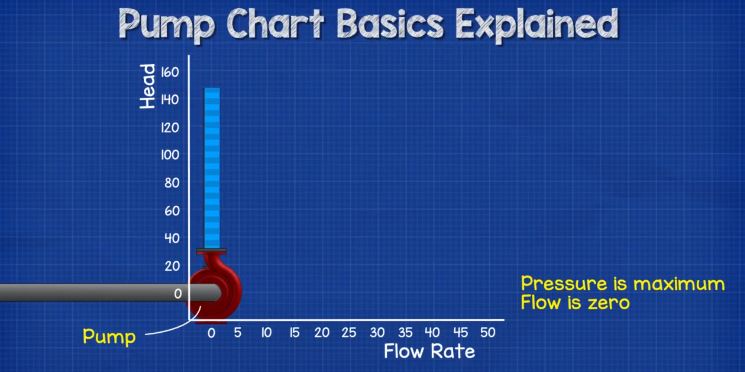
The first thing we notice is that on the main vertical Y axis we have head pressure and on the horizontal X axis we have the flow rate.
Basically, the head is pressure and the flow rate is how much water the pump can move.

What do these charts represent? If we turned the pump sideways and connected it to a pipe. The pump is pushing the liquid horizontally, so there is no pressure, but the water is flowing at its maximum flow rate. As we slowly rotate the pump towards the vertical position, we see the flow rate decreases but the pressure increases. That’s because it’s now pushing against the water and the friction. As we get all the way to the vertical position, there is zero water flowing out of the pump but maximum pressure. That’s because it’s using all its energy to push against the water and hold it as high as it possibly can within the pipe. At this point it’s just spinning the same bit of water which isn’t good for the pump so you don’t want to run a pump like this in the real world. By recording the values during this elevation, we basically get our performance curve. Although we will note that pump manufacturers don’t test pumps this way as it’s not practical.
If you want to know how a centrifugal pump works then we have covered this in detail in our previous article. CLICK HERE.
Head Pressure
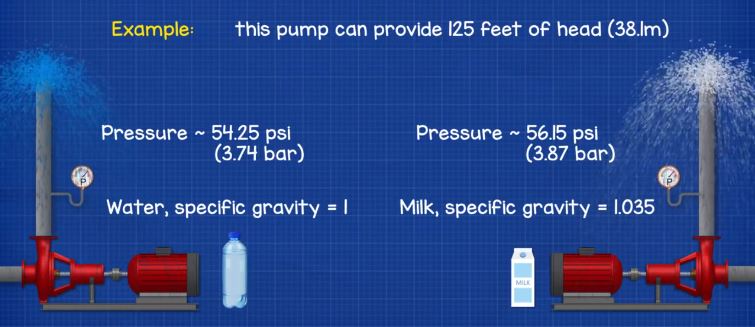
Head is shown on the vertical axis and this is referring to pressure, so we often hear the term head pressure. We measure head in feet or meters, which doesn’t seem correct considering we’re talking about pressure. Especially as you see the pressure gauges on the pump typically reading psi or bar. The reason for feet or meters is that pump manufacturers only know how high their pump can push a liquid, they do not know which liquid your system will be pumping and as each liquid has different properties, the pressure will vary depending on the liquid used but the height it can be moved by the pump will remain the same.
For example we have this pump which can provide 150 feet of head (45.72m). If we use it to pump water the the pressure will be around 54.25 psi (4.485 bar). But if we use it to pump milk then the pressure will be around 56.15 psi (4.64 bar).
Conversion between feet and meters of head is easy, we have a free calculator for that, CLICK HERE.
Why Do We Need To Know The Head Pressure?
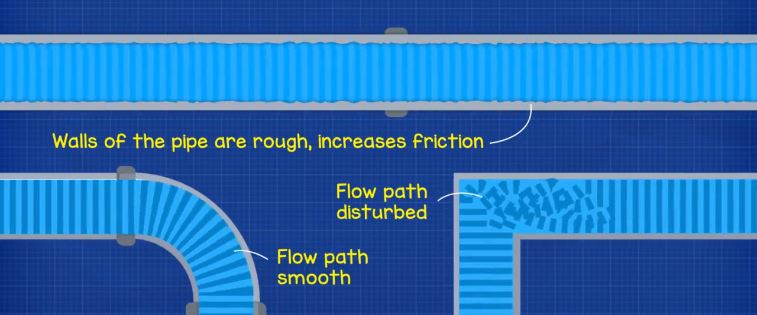
Pumps are usually used to move liquid to a higher region so we need to ensure our pump can reach this elevation. As we pump liquid through pipes and fittings, friction will try to oppose the flow. This occurs from the walls of the pipe and also disturbances to the flow path, this causes pressure loss which wastes the energy from the pump. The amount of friction depends on the liquid type as well as the materials and fittings used. Therefore, we must calculate how much friction, or pressure loss, our system will generate and ensure the pump we select can overcome this, otherwise we’re not going to get any liquid out the other end.
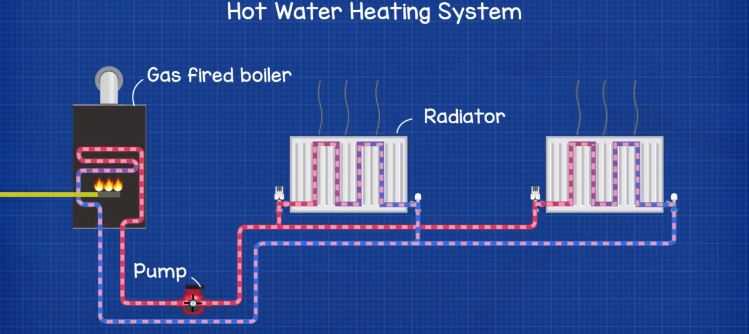
When we look at the charts we’ll find pumps ranging in head and flow rate. For example when we look at a small domestic heating system, there are a few fittings and short pipes so there isn’t much pressure drop so we would use a pump with a relatively low head pressure.
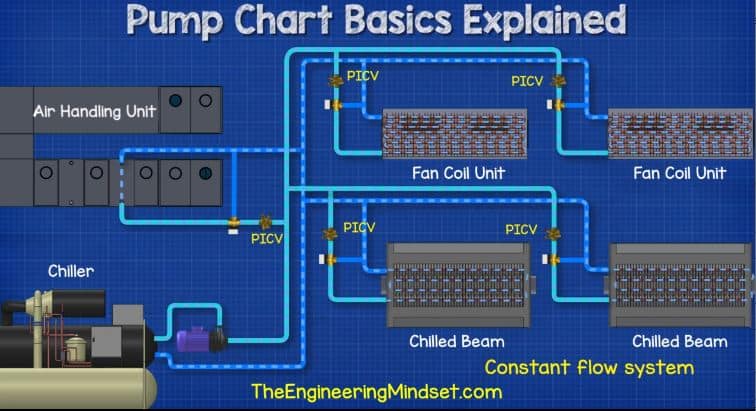
When we look at a commercial heating system with multiple AHU’s, fan coils and long pipe lengths we know the pressure drop will be high so we would need a pump that can provide much more head pressure.
Flow Rate
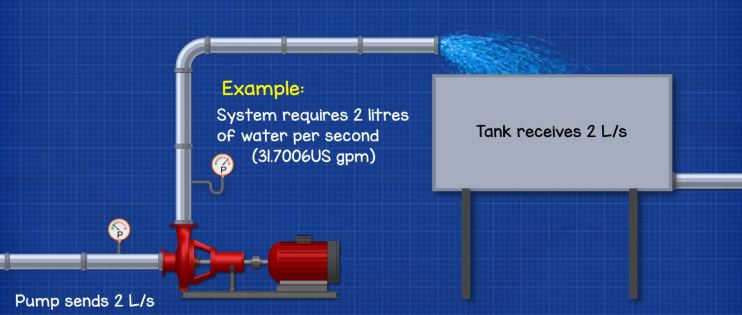
The flow rate is a measurement of how much water is flowing from the pump in a given time frame. This is measured in different units for example (US) gallons per minute, litres per second or cubic meters per hour. For example a system might be designed to move 2 litres of water per second (31.7006US gpm) from a holding tank to a process tank.
You can easily convert between metric and imperial units for flow rate with our free calculator, CLICK HERE.
Performance Curve
This is sometimes referred to as the H-Q curve. H meaning head and Q which represents flow rate. The manufacturer will test each pump to obtain the performance data and then plot this on the graph. This will represent all the possible configurations between flow rate and head pressure and we use this to check whether a pump will suit our needs.
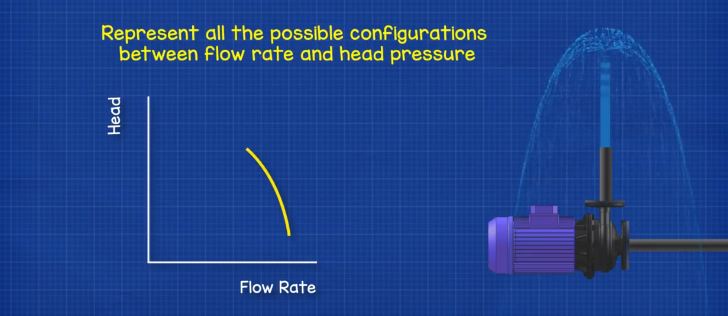
The performance curve will be different for each pump and some will suit our system needs better than others. You will usually see that as the flow rate increases, the head pressure decreases.
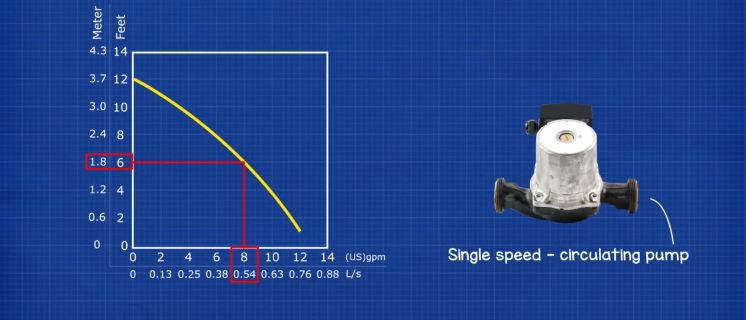
When selecting a circulating pump, the pump will only perform as per the line. So, if you need 8 GPM (0.5 L/s) then you will have 6ft (1.8m) of head. You can also get multi speed circulating pumps which we’ll look at later in the article.
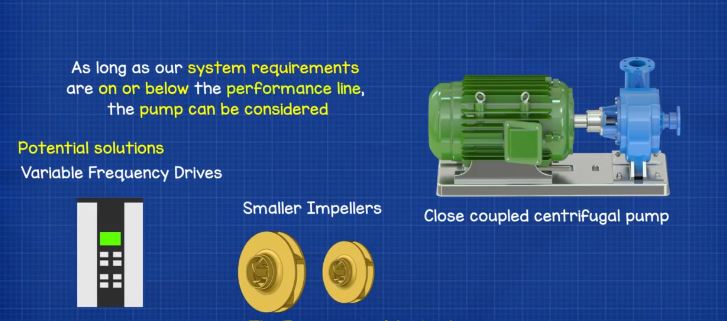
When selecting a larger centrifugal pump, as long as our system requirements are on or below the performance line, the pump can be considered. We can potentially use smaller impellers or variable frequency drives to better suit our requirements and again, we’ll look at this a little later in the article.
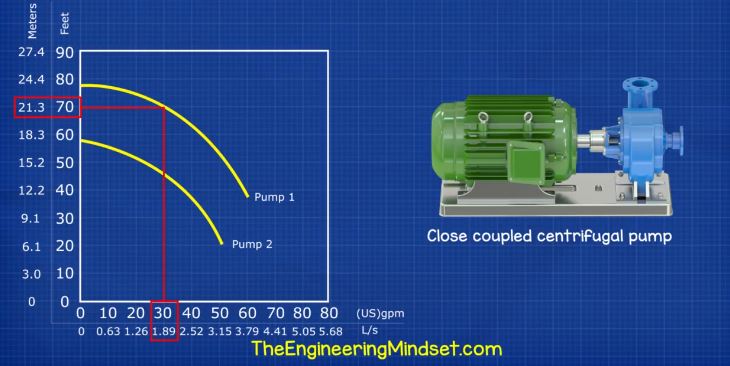
For example the performance curve for 2 large centrifugal pumps are plotted here. We need a flow rate of 30 gpm (1.89 L/s) and a head pressure of 70 feet (21.3m) which is here on the graph. That means pump 2 can’t be used but pump 1 could be.
Impeller Size
With centrifugal pumps we can often change the size of the impeller. The diameter of the impeller will change how much water can be moved. So on some charts you’ll see multiple performance curves which give us the performance details of the pump for different diameter impellers. The size of the impeller will often be listed at the end of the line.
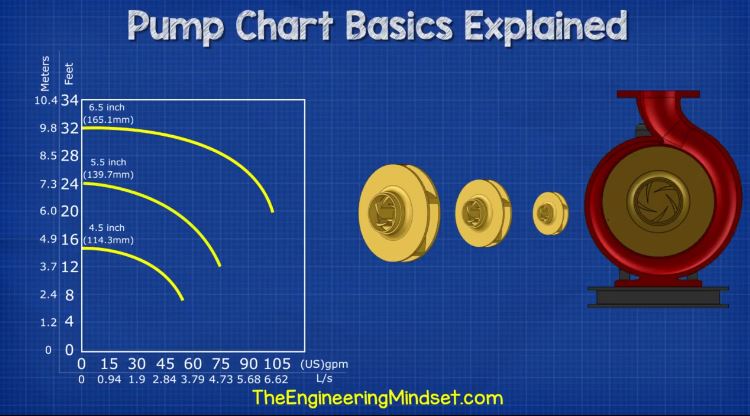
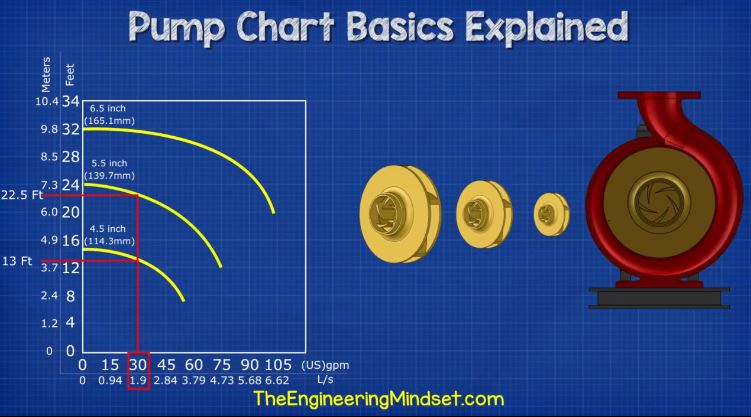
For example 30 gmp (1.89 L/s) for a 4.5 inch (114.3mm) impeller gives us about 13 feet (3.96m) of head but if we used a 5.5 inch (139.7mm) impeller then we would get around 22.5 feet (6.89m) of head.
In some instances our required flow rate and head pressure might fall between the two impeller diameter lines. In such cases we can often machine the impeller down to the required size to get a better match. You should ask the pump manufacturer or a pump specialist to carry out this service. The performance of the pump then needs to be calculated.
Pump Power
As we know, pumps require mechanical power to spin the shaft, rotor and ultimately move the water. Pump manufacturers will usually provide a separate chart which plots this power requirement. In imperial units we use brake horse power and in metric units we use kilowatts.
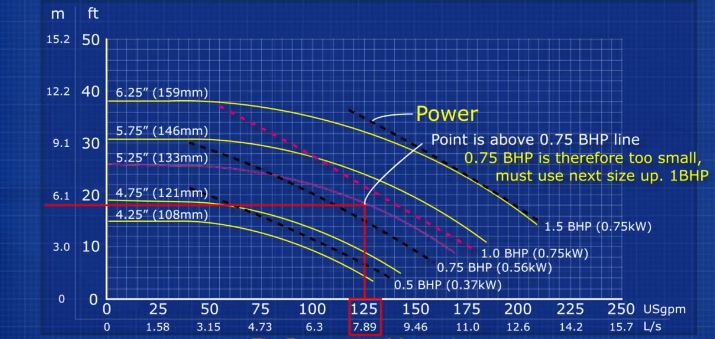
With this chart we see the break horse power plotted at various intervals. As you can see, as the flow rate increases, so does the power requirement. We use this chart to size our motor. For example if we needed 125 gmp (7.89 L/s) with 18 feet of head (5.49m), then this is between the 0.75 (0.559kW) and 1 horse power lines (0.746kW). As this point is above the 0.75 line, this means we can’t use a motor of this rating because it will not be able to cope, we will have to go a 1 bhp motor and we see the performance curve falls completely under this line so if our head pressure calculation is wrong we have a safety margin.
If you want to convert between brake horsepower and kilowatts, then check out our free calculator, CLICK HERE
Efficiency
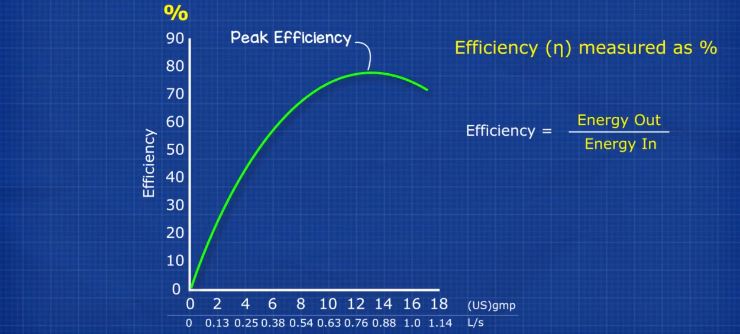
Some charts will display the efficiency curve for the pump. This is measured in percent and we usually see this parabolic curve where the pump increases in efficiency up to its maximum and then starts to decline again.
Charts that display different impeller sizes will usually have efficiency displayed in these more complex plot lines. Each line displays the percentage of efficiency.

In both charts you can see that the efficiency varies depending on how you operate the pump. In multiple impeller charts we see that the efficiency decreases as the impeller size decreases, that’s because the gap between the impeller and the pump casing increases so water can circulate in this region and therefore energy is wasted.
The efficiency is the ratio or comparison between the amount of energy going into the pump vs the amount of energy we get out of the pump. So, ideally we want to be as close as possible to the peak for optimal performance.
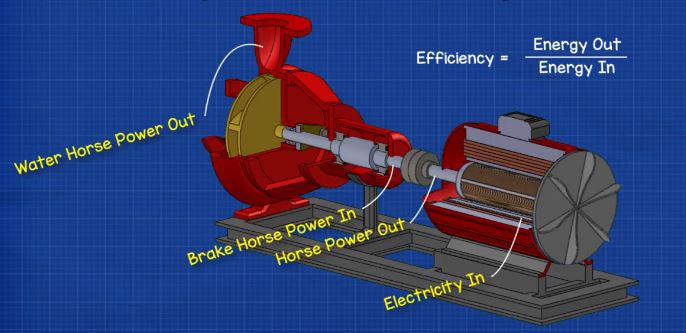
The pump will inevitably lose some power when it converts and transmits the electrical energy into mechanical energy. This will be lost through the coupling, bearings, shaft, seals, cooling fan etc. For example on this chart we can see that if the pump provided 125 gmp at 20 feet of head then it would run at around 67% efficiency which isn’t very good. If the same pump operated at 30 feet of head 138 gmp then it would operate at its peak performance of 73% which is better.

NPSH
We discussed NPSH in our previous article. This is the required NPSH or Net Positive Suction Head Pressure. This usually has an upward curve which means as the pump flow rate increases, we see the NPSH value also increases. We measure this in meters or feet, sometimes kilopascals.

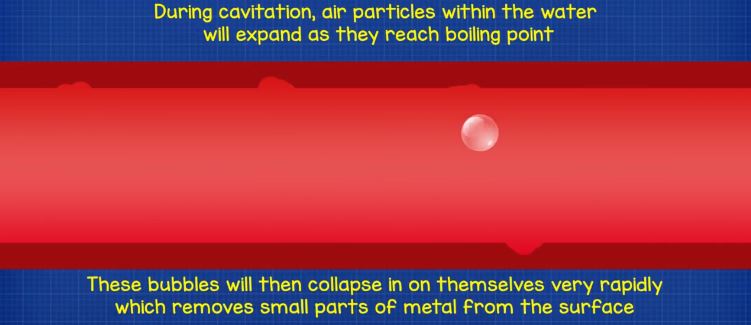
The NPSH is the minimum pressure that must be available at the suction inlet of the pump to overcome the entrance losses and avoid cavitation. The available pressure at the inlet must therefore be greater than this value. Just to recap, cavitation is where the pressure at the inlet of the pump reaches a low enough point that the water begins to boil, this creates rapidly expanding and collapsing air bubbles which will gradually destroy the surface of the pump and casing.
For example, if we were moving 150 gmp (m) then we require an NPSH of around 4.9 feet (1.49m).
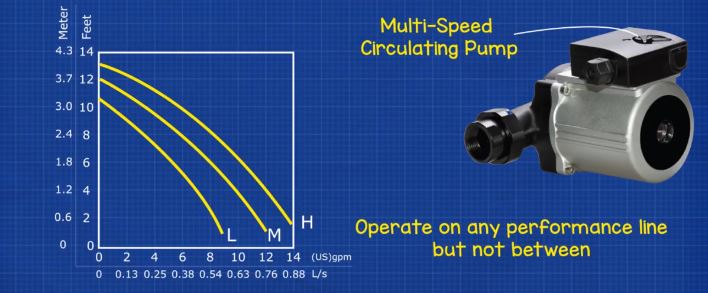
Multi Speed Pump

Some pumps such as the one above; operate at a fixed speed and therefore have a fixed performance curve, but we can also get multi speed versions which have the ability to switch between speed settings, usually with 3 different speeds, low medium and high. These pumps will therefore have a chart with three different profiles plotted on them.
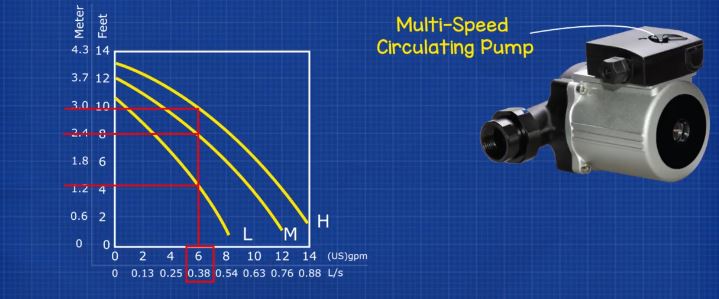
We can operate the pump on any of these curves but not between them. So, for this example if we wanted 6 gallons per minute or 0.38 litres per second then on setting 1 we get around 4.2 feet (1.28m) of head, setting 2 we get 8 feet (4.44m)of head and setting 3 we get around 9.8 feet (2.99m).
These pumps allow us to easily improve our match between pump performance and system requirements or allow for future expansion to the system.
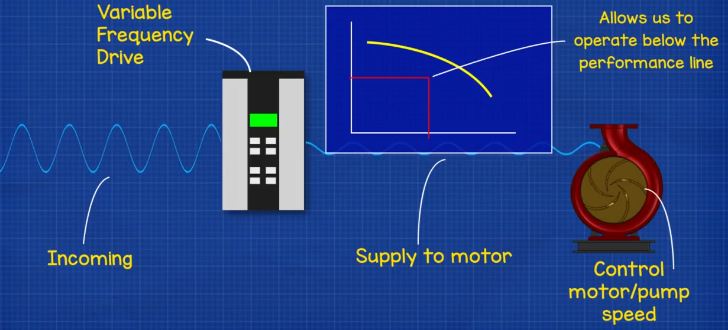
Variable Speed/Frequency Drives
Another option we have is to use variable frequency or variable speed drives. This basically takes the electrical supply and alters it to reduce the voltage and frequency which therefore alters the power of the motor and the speed of the pump. We can increase or decrease the speed via the controller to better improve our pump match and therefore operate nearly anywhere in the region below the curve.
These are only really used on larger pumps, typically over a 2 kW (2.7 BHP) in size. They can come pre-installed with the pump motor or you can often retrofit an existing pump but you should check with the manufacturer first to ensure compatibility. Additionally, you should check the system design to ensure it can handle the lower flow or head pressure. To obtain the performance details for variable speed pumps we have to calculate the values using pump affinity laws. We’ve covered this previously in worked tutorials, CLICK HERE.
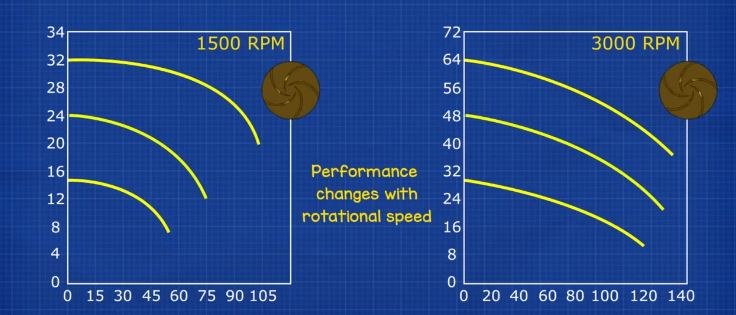
Rotational Speed
Some pump manufacturers will provide separate charts for operating the pump at different rotational speeds. We can then compare the performance to get a close match and then find an electrical motor which will suit this. Typically, higher rotational speeds lead to more service and maintenance so where possible it’s good practice to choose a lower speed pump that meets our systems requirements.
Voltage and Frequency
Do check the specifications of the electrical motor. The voltage and frequency for mains electricity vary around the world so you want to ensure the pump you select will operate where you are installing it. Additionally, pumps come in single as well as three phase designs depending on the application. These details will be provided by the manufacturer and usually come on the chart or technical document.


")

")

Very useful content Paul and well explained with graphs,
Can you also pl explain how to read psychrometric chart